Genetic Map is a page where users can find and view Genetic Maps. There is limited Cannabis QTL and genetic markers studies available in PubMed publications.
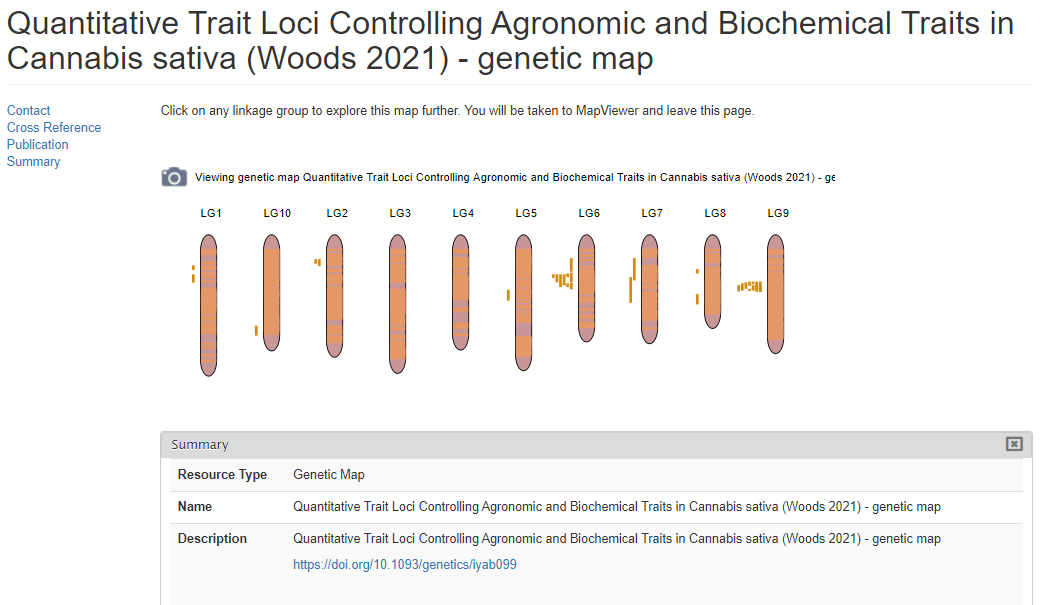
- Select a particular genetic study to display map details with graphical representation of all linkage groups.
- Click a linkage group on the image opens the MapViewer which displays the complete linkage group on the left, and the selected region on the right. The selected region can be changed by dragging and resizing a window on the complete linkage group on the left side. There is a legend of the marker colors below the linkage group figure. Information about the markers is displayed in the upper right corner when the pointer is over a marker name on the right side graph. Clicking on the marker name on the rights side graph, opens the marker details page.
-
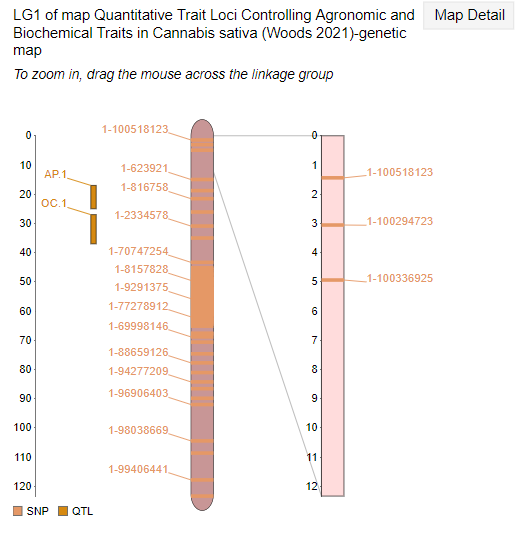
A different map or linkage group can be displayed using the controls at the bottom of the MapViewer page. The color of the markers and which markers are displayed can be changed with the controls. The ruler and marker positions can also be toggled on or off. After changing any of the four parameter sections, the Submit button must be pressed to display the changes.
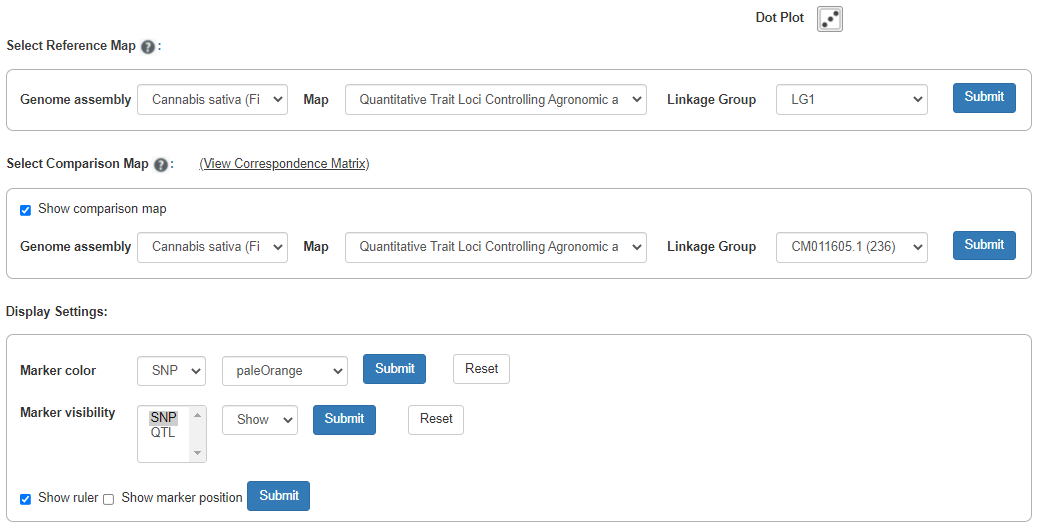

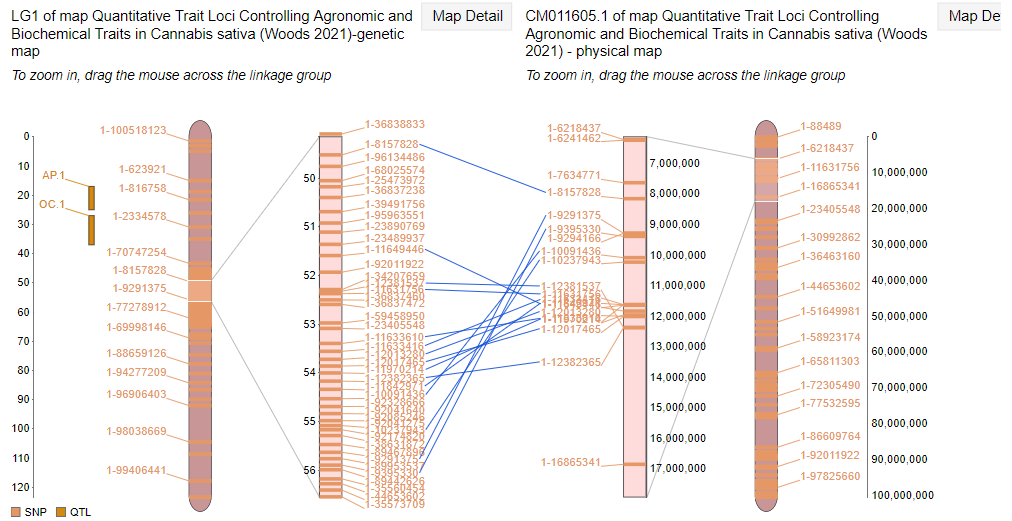
- Two linkage groups can also be displayed side by side to compare locations of similar markers.